If your customers / end users for your product are physicians, you have a highly demanding audience. Their tools need to work every time. If your products aren’t living up to a high standard, then physicians and hospitals may need to take their business elsewhere.
If you’re working with patients / consumers, your job isn’t any easier. While physicians are willing to jump some hurdles to get the data they need, most consumers are not.
Not a lot of room for error in either case, right?
The good news is you have so many great tools you could potentially use to help measure your product experience. Do a quick Google search, and you’ll see there’s no shortage of options.
Before you pick one and start spending all that money, let’s pause to see what you may already have available. This process can help you identify where your gaps are and whether you actually need to add another tool.
Please note that I’m not talking about whether or not the digital components of your product work properly or not in this article. I’m assuming your dev team has already worked through the necessary testing procedures. This piece is focused on how your product feels and what kind of experience your customer enjoys.
Let’s Start with the Data You (May) Have
We’ll want to start with what a regular analytics program can provide.
- Where are pageviews the highest?
- How long are users staying on the platform?
- Are they initiating any downloads of data (if possible)?
- How many users are returning?
Here’s where you’re going to run into some limitations quickly if you’re using a standard implementation of analytics. Most programs are configured to answer the above questions from an individual device standpoint.
Let’s say Dr. Smith accesses the system from her work computer, then drives home and access the system from her home computer. Your analytics program is going to say that was two different visitors, and you have no return visits.

This means you’ll have a hard time understanding how consistently useful your app is in this circumstance.
Beyond Analytics
Some other tools you may have access to could include scroll maps, click maps, and heat maps.
Heatmapping can help you track things like mouse position and scrolling that you wouldn’t be able to get from other types of analytics reporting. It can also be helpful in identifying non-link elements that users try to click on, which can help to inform design decisions.
Scroll maps and click maps provide the kind of data you’d expect: how far down the page users scroll and what users click on, respectively.
(For a much more in-depth explanation, Hotjar can walk you through those tools here. While we’ve used Hotjar in the past, we’re currently using Matomo for similar analyses.)
The goal here is to understand, on average, what elements of the site visitors are using. If there’s a key feature lower down on the page that users never see because they don’t scroll far enough, you have some changes to make. Even if the feature is visible but users never click on it (as your click map will tell you), then you still have a pathway towards making changes.
Job #1: Enable Some Form of User Tracking
There are lots of ways to set up user tracking depending on the analytics program you’re using. We had to do a bit of custom programming on a recent project to ensure that our analytics tools could understand how to group user behavior together properly, so you’ll want to work with your IT team on getting this running.
The good news is that it is possible to set this kind of tracking if you have an online system where your customers currently have to login. Depending on privacy regulations for your scenario, you may not necessarily know exactly who is using your site. The key is that you can link session data together. This will give a different level of context to all your reports.
Linked session data will help you answer the basic question of how often users return. You’ll also be able to identify who your power users are. Even if you don’t know who the users are by name, you can understand some important user behaviors.
Goal for User Tracking
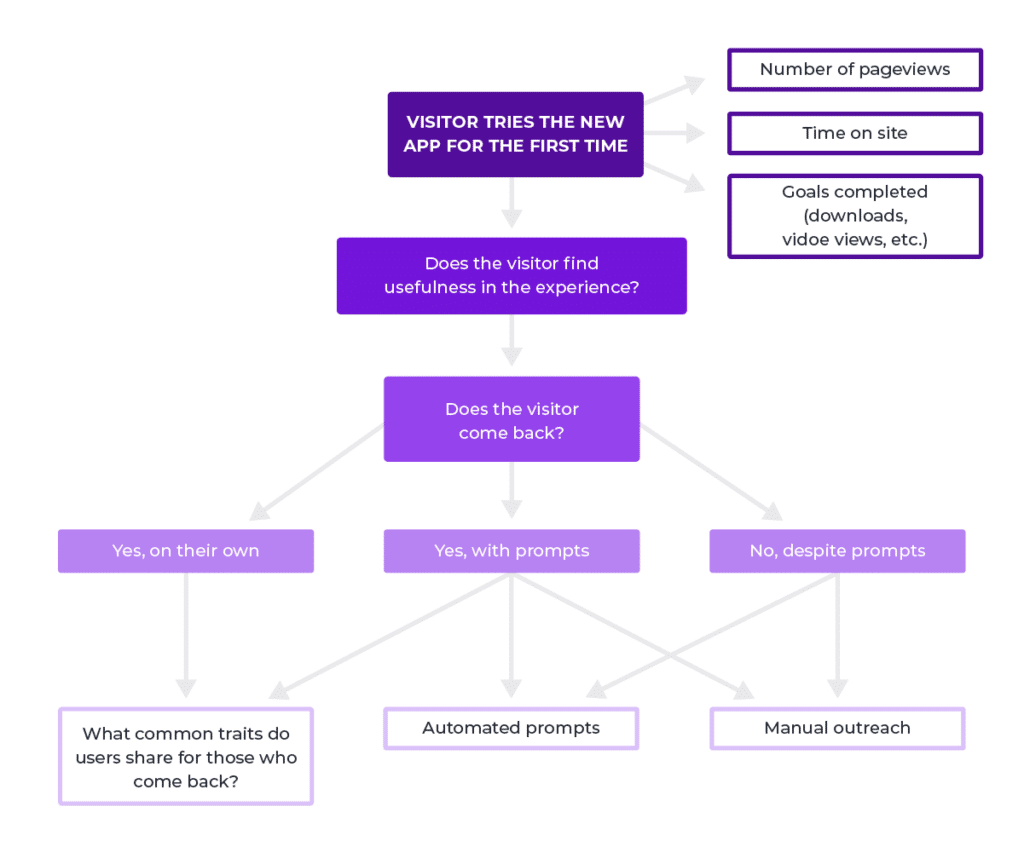
Your immediate goal is to get to a scenario where you can observe the following flow:

Although you will certainly have some goals you’d like to see your visitors complete, defining usefulness is likely something you’ll have to do after seeing which users come back to the system. Remember, our goal here is customer retention. We want to know who finds your system so useful that they come back for more.
Perhaps usefulness is defined by a combination of activities (viewing a case or a resource, then going on to download a file or view a video). Usefulness could be defined by an amount of time spent on the application (at least hitting some minimum threshold).
Additionally, your customers can help you define usefulness if customer success or sales teams reach out. We’ve included some tips a bit later in the article to make sure your collecting your feedback in a helpful format.
When you can start analyzing data at a user level, you need to group folks into three buckets (to start):
- Repeat users
- Single-time users
- Power users (a subset of your repeat users)
The more you can understand the differences between the three, the more opportunity you have to potentially influence the experience of the single-time users. These adjustments may happen at a variety of levels: the sales process, onboarding, layout of the application, or follow-up communication after the first login.
Reviewing the Data with the Right People
Some reporting tools include automated insights to help you parse all the information available to you, and it can be quite helpful. There are also times when these kinds of tools provide somewhat useless information.
Let’s just take web analytics as a simple example. Sometimes, a report may tell me that organic traffic has dropped by 16 percent, and I’ll look to see that there’s an error with one of our top pages. The error caused the page to get removed from Google results entirely or to drop in rank. Obviously, I need to jump on that problem right away.
That’s useful, right?
Then, there are times when I’ll get an alert that traffic from a referring site has increased by 300%. Excitedly, I click through to find out that when I went from 2 visitors last month to 8 this month.
That’s not bad news. Still, it’s not necessarily impactful to our business.
This is the kind of experience that can happen if you view metrics in a silo and don’t involve the right people.
Design or Development
You need folks familiar with the product design to help analyze what your users are doing. Some user session analysis tools I’ve seen will include things like sentiment analysis, based on indicators like rapid page changes, repeated clicking on an item, etc. These indicators are sometimes accurate and sometimes not. Perhaps a user is only looking for a very specific element on each page and can see it upon page load. This allows this user to move rapidly through the pages.
By pulling in someone familiar with the design (perhaps that’s you, the one doing the analysis in the first place), you’ll be able to better understand what the user is attempting.
Sales or Customer Success
If you can link customer data to your user sessions, it can also be helpful to bring in someone who is active in the customer relationship to help provide extra context. What has Dr. Smith mentioned as reasons that she uses the application? Is she specifically looking to export a file to show off during an upcoming presentation?
Again, this is going to help you make better conclusions about any recorded activity from her account.
Create Ways for Users to Provide Feedback Easily
Yes, it’s great to be able to look to different tools to understand user behavior, but give real people a chance to tell you what’s going on. At a minimum, create a form on the site or include an email address for users to express their thoughts.
You can get fancier by including a chat box or a more “intelligent” feedback feature that can help report the exact page where feedback is occurring. There are lots of ways to scale up your feedback gathering.
Just make sure you get started in one way or another, even if it isn’t a perfect or scalable process just yet.
Be Proactive
Set up a regular cadence of reaching out for feedback after new customers start using your application. Two weeks in, try reaching out to see if users want to provide any thoughts via email or have someone give a customer a call.
I’d recommend creating a set of questions for your team to ensure you’re getting the best opportunity to collect useful feedback. Instead of having someone ask “do you like it?”, team members can ask if any features were particularly useful or frustrating.
Just make sure your team members have an easy way of passing along that information to you. You don’t want to wind up in a spot where you’re only getting incomplete feedback weeks later.
What about Users who Drop Off?
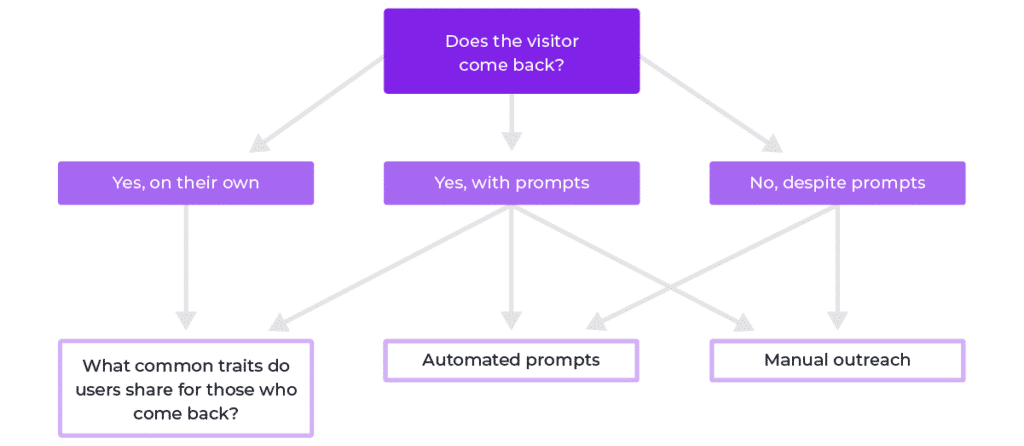
Let’s go back to just a portion of our diagram for a second, and let’s see what happens after someone visits the site the first time.

Not every user will be rushing back to log on again, so you’ll need a plan to re-engage.
This could be tied to a physician’s recently completed case, like an email reminder that goes out once case data is available. It could also be a reminder that goes out if the user hasn’t logged into the system to review a case within a week of its going live.
Or, you could take an approach where you send a reminder if a user hasn’t logged in to the system within a month (or whatever time period you think is correct). Provided that new data is available within that time-frame, your system is providing potentially useful data that the physician could really use.
In combination with regular communication about new features or product news, this can help keep users engaged with the product.
Once you have these pieces in place, you can review to see whether you need any additional tools to measure product experience. I find it’s helpful for folks to ease their way into these various metrics instead of diving too deeply the first time out. This gradual process will help you identify more precisely what problem you’re trying to solve, meaning you’ll be able to find the right solution more quickly.
Related Reading
Michael spends a great deal of time with the healthcare industry both professionally and personally, which gives him the perspective of what stakeholders on either side of the care equation need.
He began coding in 2008 and subsequently shifted his attention entirely to online marketing. Michael completed his MBA in 2018, focusing on the intersection of healthcare and marketing.


